Quantcast
Channel: Ethio Helix ኢትዮ:ሒሊክስ
Viewing all 74 articles
Browse latest View live

YDNA from Southern Africa

$
0
0
Naidoo et. al (2010) reports YDNA from 3 different groups in Southern Africa with a fair amount of resolution.
Electropherogram and phylogeny

Here below are the frequencies found:


Ethiopian Lions are Distinict

$
0
0


Lion (Panthera leo) numbers are in serious decline and two of only a handful of evolutionary significant units have already become extinct in the wild. However, there is continued debate about the genetic distinctiveness of different lion populations, a discussion delaying the initiation of conservation actions for endangered populations. Some lions from Ethiopia are phenotypically distinct from other extant lions in that the males possess an extensive dark mane. In this study, we investigated the microsatellite variation over ten loci in 15 lions from Addis Ababa Zoo in Ethiopia. A comparison with six wild lion populations identifies the Addis Ababa lions as being not only phenotypically but also genetically distinct from other lions. In addition, a comparison of the mitochondrial cytochrome b (CytB) gene sequence of these lions to sequences of wild lions of different origins supports the notion of their genetic uniqueness. Our examination of the genetic diversity of this captive lion population shows little effect of inbreeding. Immediate conservation actions, including a captive breeding programme designed to conserve genetic diversity and maintain the lineage, are urgently needed to preserve this unique lion population.

Source

From the Press:
............A Scientist from the University of York, Michael Hofreiter, said of the DNA tests on 15 of the 20 Ethiopian lions kept in Addis Ababa Zoo have revealed that they form a separate genetic group from the lions of east Africa and southern Africa. He said that the male lions are the last lions in the world to possess the distinctive dark brown mane. They are the direct descendants of a group of seven males and two females taken from the wild in 1948 for Haile Sellassie's own zoo.
According to him, a comparison with other populations of wild lions living in the Serengeti of Tanzania in East Africa and the lions of the Kalahari Desert of South-West Africa found that the Addis Ababa lions are quite separate genetically. Dr Hofreiter also said the study team believes that "the Addis Ababa lions should be treated as a distinct conservation management unit and are urging immediate conservation actions, including a captive breeding program, to preserve this unique lion population [not are expected to be more than a few hundred]".
Susann Bruche of Imperial College London, the lead author of the study published in European Journal of Wildlife Research, said that it is important to preserve the genetic diversity of the Ethiopian lions to help the species as a whole. She said "We hope field surveys will identify wild relatives of the unique Addis Ababa Zoo lions in the future, but conserving the captive population is a crucial first step".

An early and enduring advanced technology originating 71,000 years ago in South Africa

$
0
0
There is consensus that the modern human lineage appeared in Africa before 100,000 years ago1,2. But there is debate as to when cultural and cognitive characteristics typical of modern humans first appeared, and the role that these had in the expansion of modern humans out of Africa3. Scientists rely on symbolically specific proxies, such as artistic expression, to document the origins of complex cognition. Advanced technologies with elaborate chains of production are also proxies, as these often demand high-fidelity transmission and thus language. Some argue that advanced technologies in Africa appear and disappear and thus do not indicate complex cognition exclusive to early modern humans in Africa34. The origins of composite tools and advanced projectile weapons figure prominently in modern human evolution research, and the latter have been argued to have been in the exclusive possession of modern humans56. Here we describe a previously unrecognized advanced stone tool technology from Pinnacle Point Site 5–6 on the south coast of South Africa, originating approximately 71,000 years ago. This technology is dominated by the production of small bladelets (microliths) primarily from heat-treated stone. There is agreement that microlithic technology was used to create composite tool components as part of advanced projectile weapons78. Microliths were common worldwide by the mid-Holocene epoch, but have a patchy pattern of first appearance that is rarely earlier than 40,000 years ago910, and were thought to appear briefly between 65,000 and 60,000 years ago in South Africa and then disappear. Our research extends this record to ~71,000years, shows that microlithic technology originated early in South Africa, evolved over a vast time span (~11,000years), and was typically coupled to complex heat treatment that persisted for nearly 100,000years. Advanced technologies in Africa were early and enduring; a small sample of excavated sites in Africa is the best explanation for any perceived ‘flickering’ pattern.

Closed Access 

STRUCTURE run on High/Low Altitude Ethiopians

$
0
0

The pdf can be downloaded here

Regarding the populations sampled, the paper notes the following:

The high altitude (HA) Amhara are agropastoralists living in a temperate Afro-alpine ecosystem in the Simien Mountains National Park at altitudes ranging from 3500-4100 meters (m). Altitudes above 2500m on the East African Plateau have been inhabited for at least 5 thousand years (ky) and altitudes around 2300-2400m for more than 70ky [24,25].”

Plus:

DNA was extracted from blood samples provided by 192 Amhara individuals living at 3700 m in the Simien Mountains National Park or at 1200 m in the town of Zarima.”

For the Oromo:

The HA Oromo are pastoralists herding cattle, sheep and goats and living in a temperate Afro-alpine ecosystem in the Bale Mountains National park and reside on the Sanetti Plateau at 4000-4100m. The HA areas of the Bale Plateau have been inhabited by Oromo since the early 1500s according to historical records [22,23].”

Plus:

79 individuals lived at 4000 m in the Bale Mountains National Park while 39 individuals lived at 1560 m in the town of Melkibuta.”

Melkibuta is probably a typo for Melkabuta, Bale, close to Goro, Bale which I have used as a proxy town in the map below for the location of the LA Oromo samples. 
Green= Low Altitude Amhara, Orange = High Altitude Amhara , Yellow = Low Altitude Oromo, Purple = High Altitude Oromo


Regarding the STRUCTURE run it says:

This position is further supported by the Bayesian clustering analysis performed using the program STRUCTURE [85]. In this analysis, 3 different sets of 57652 SNPs were used to infer the ancestral composition of each population assuming 7 ancestral groups. The STRUCTURE plots clearly show that Ethiopian populations share ancestral components with sub-Saharan African and Middle Eastern populations falling in the middle of the ancestry gradient between these two groups of populations (Figure S2.”

and Interestingly:

We also calculated the haplotype diversity and compared it to that observed in the worldwide populations. Interestingly, the Oromo (0.822) and Amhara (0.810) haplotype diversity values are as high as or higher than the highest values [80] observed in the HGDP, i.e. Bantu (0.818), Biaka Pygmies (0.815), Yoruba (0.815) and Mandenka (0.807); this is true regardless of altitude (0.798 for HA Amhara; 0.803 for LA Amhara, 0.813 for HA Oromo, and 0.813 for LA Oromo).”


There is also an FsT based Global neighbor joining tree in the PDF with a familiar outcome.


UPDATE: As far as the 7 clusters found in this global STRUCTURE run;
Cluster 1 (Blue) : Dominates in Sub-Saharan Africa, peaking in the hunter gatherers, AKA, Pygmy and Khoisan (Amhara ~28% , Oromo ~ 35%, Maasai ~ 56% )

Cluster 2 (Purple) : Dominates mostly in the Ethiopian and Maasai samples, but also found in North Africa, Near-east and West Africa in fairly significant amounts. (Amhara ~44% , Oromo ~ 44%, Maasai ~ 38% ) 

Cluster 3 (Green) : Dominates in West Asia / Europe, with a peak in the Sardinians. (Amhara ~28% , Oromo ~ 21%Maasai ~ 6% )

Cluster 4 (Orange) : Dominates in South Asia, peaking with the Gujarati samples.

Cluster 5 (Teal) : Dominates in East Asia.

Cluster 6 (Light Blue) : Dominates with Native Americans.

Cluster 7 (Brown) : Dominates with Oceanians.

Unfortunately the K=2 to 6 runs have not been reported, making it hard to gauge how this particular dataset would stack up relative to other global datasets.

UPDATE2: Comparing with ADMIXTURE.

Here, I compare the cluster breakdowns (or peaking populations) of the Global STRUCTURE run of this post, with the clusters formed in the ADMIXTURE global K=7 runs I have done in the past on two separate datasets, both datasets can be downloaded from here.

Dataset 1, Global, K= 7, Without Pagani 2012 East African Samples.

Cluster1:sardinian,basque,spaniards,italian,tuscans

Cluster2: dogon,yoruba,bambaran,hausa,igbo

Cluster3:irula,tn-dalit,ap-mala,ap-madiga,north-kannadi

Cluster4: san-nb,san,!kung,pygmy,mbutipygmy

Cluster5:papuan,melanesian,tongan,samoan,paniya

Cluster6:colombian,surui,karitiana,pima,totonac

Cluster7: she,han,chinese-americans,singapore-chinese,chinese

Dataset 2, Global, K= 7 , With Pagani 2012 East African Samples.

Cluster1:papuan,irula,tn-dalit,ap-mala,ap-madiga

Cluster2:sardinian,basque,spaniards,italian,tuscans

Cluster3: san-nb,san,!kung,pygmy,mbutipygmy

Cluster4:colombian,karitiana,surui,pima,totonac

Cluster5:she,chinese,han,chinese-americans,singapore-chinese

Cluster6: yoruba,dogon,brong,igbo,bambaran

Cluster7: ARI-B,ARI-C,Gumuz,Somali,EtS-P

The clusters highlighted in yellow are clusters also found by the STRUCTURE run of this post (at least roughly), the main differences are in the African clusters, while ADMIXTURE split the African clusters between a West African, Hunter Gatherer and East African (only in the case of the Pagani inclusive samples), the STRUCTURE run did not find 3 but rather only 2 African components, instead, as a compensation it split the Oceanians from the South Asians. There can only be three explanations to these differences in results:

  1. The SNPs used are from different regions of the genome
  2. The way STRUCTURE splits components is different from ADMIXTURE
  3. The difference in sampling of the global datasets (of which those of the ADMIXTURE runs were more complete)

Or all 3 could be true with varying degrees of impact. The only way to verify is by running ADMIXTURE with a global dataset similar to the one in this post.


Extensive Doctoral Thesis on Ethiopian Y and mtDNA

$
0
0
I was contacted earlier by Dr. Chris Plaster about a doctoral thesis on Ethiopian Y & mtDNA that was completed 2 years ago but had been embargoed to the public until only about two months ago. As this is the first time I am coming across of it, plus since it is 204 pages long I have not had a chance to go through it thoroughly, but suffice it to say that this is the most extensive work on Ethiopian NRY & mtDNA that I have seen to date, although the resolution leaves a lot to be desired, I will update this post more as I read it more thoroughly over the next few days/weeks...


Variation in Y chromosome, mitochondrial DNA and labels of identity on Ethiopia


Some numbers and figures that caught my attention at first glance:


The Discussion section also has some interesting things to say, especially with respects to haplogroups A3b2 and J, but also the remaining ones found in Ethiopia as well.


UPDATE (11/27/2012) - Received some more resolution on a portion of the NRY data from Dr. Plaster that was carried out later and not included in the thesis:


Link to Source Document

UPDATE2: Interactive Chart of Figure 3.2 (for improved legibility)
UPDATE3 (11/28/2012)- Analyzing Ethiopian E-M34 haplotypes.

One of the more curious results with respect to the NRY haplogroups found in this dataset is the high amount (24.6%) of E-M34 in the Maale samples. Previously, Cruciani '04 (see here and here for details) had found E-M34 widespread in Ethiopia with a more Northerly concentration (Amhara - 24%, Ethiopian Jews - 14%, Oromo - 8%, Wolayta -8%), this newer data however shows the opposite, i.e a more Southerly concentration of E-M34 (Maale - 25%, Amhara - 13%, Oromo - 10%, Afar - 4%). 

To explain the apparently lower diversity of Ethiopian E-M34 haplotypes relative to ones found in the Near East, Cruciani '04 had also proposed that the lineage may have back migrated to East Africa from the Near East, although not completely abandoning the possibility that it may also have originated in East Africa.

Luckily, the data for the Ethiopian E-M34 haplotypes found in this paper is actually accompanied with STR data, 23 independent 15 marker E-M34 haplotypes. 

So this gave me a chance to compare the diversity of the haplotypes with non-Ethiopian E-M34 haplotypes that are available a the haplozone site. A compilation of E1b1b1 and subclades of E1b1b1 67 marker haplotypes from this site can be downloaded from here. For this analysis only E-M123 and E-M84 haplotypes are used.

The method I used to compare the haplotypes is the same as outlined in this previous blog post. The only difference is that I am constrained with the number of markers available to me, thus I have used 14 of the following markers to compare haplotype diversity/TMRCA:

DYS19 DYS388 DYS390 DYS391 DYS392 DYS393 DYS389I DYS389II DYS437 DYS438 DYS439 DYS448 DYS456  Y GATA H4

where the marker DYS635 is unfortunately missing in the haplozone site and is not included in the analysis.

The TMRCA results for the 3 different datasets (E-M34_Plaster, E-M123_Haplozone and E-M84_Haplozone) are as follows:


Dataset:E-M34_Plaster
Sample size:23
Years/Generation:28 - 33
TMRCA Range:4590 - 7558
Mean TMRCA:6055
Median TMRCA:5920
SD:836

Year/Generation =28 detailed:
finalsummary =

{
  [1,2] = Chandler;14 Markers  TMRCA(Median)--5920.7 TMRCA(Modal)--6412.9
  [1,3] = Stafford;14 Markers  TMRCA(Median)--5120.6 TMRCA(Modal)--5593.2
  [1,4] = Burgarella_Navascues;14 Markers  TMRCA(Median)--4988.7 TMRCA(Modal)--5635.7
  [1,5] = Ballantyne;14 Markers  TMRCA(Median)--4590.1 TMRCA(Modal)--4993.9
}


Dataset:EM123_Haplozone
Sample size:129
Years/Generation:28 - 33
TMRCA Range:4120 - 6131
Mean TMRCA:5067
Median TMRCA:5147
SD:667

Year/Generation =28 detailed:
finalsummary =

{
  [1,2] = Chandler;14 Markers  TMRCA(Median)--5202.1 TMRCA(Modal)--5202.1
  [1,3] = Stafford;14 Markers  TMRCA(Median)--4405.3 TMRCA(Modal)--4405.3
  [1,4] = Burgarella_Navascues;14 Markers  TMRCA(Median)--4121 TMRCA(Modal)--4121
  [1,5] = Ballantyne;14 Markers  TMRCA(Median)--4330 TMRCA(Modal)--4330
}


Dataset:E-M84_Haplozone
Sample size:69
Years/Generation:28 - 33
TMRCA Range:3666 - 5124
Mean TMRCA:4458
Median TMRCA:4347
SD:483

Year/Generation =28 detailed:
finalsummary =

{
  [1,2] = Chandler;14 Markers  TMRCA(Median)--4347.9 TMRCA(Modal)--4347.9
  [1,3] = Stafford;14 Markers  TMRCA(Median)--3666.2 TMRCA(Modal)--3666.2
  [1,4] = Burgarella_Navascues;14 Markers  TMRCA(Median)--3885.7 TMRCA(Modal)--3885.7
  [1,5] = Ballantyne;14 Markers  TMRCA(Median)--4219.2 TMRCA(Modal)--4219.2
}


It is not necessary to get fixated on the absolute TMRCA numbers, rather what is more informative are the relative TMRCA numbers, since the mutation rates being used for all 3 datasets come from the same source. In addition, the absolute TMRCA is not very informative due to the low number of markers, for instance, if I used these same 14 markers to compute a mean TMRCA across all 4 mutation rate sets for the E-M35 balanced dataset, I get 7,038 YBP, where as if I use 46 markers across all mutation rates I get a mean TMRCA of 11,984 YBP and yet again if I use 66 markers (but limited only to the Chandler mutation rates) I get a mean TMRCA of 14,802 YBP. So a reasonable amount of markers are needed before the absolute TMRCA starts to plateau to a meaningful number.


However, the relative TMRCA's clearly show the Ethiopian E-M34 haplotypes to be more diverse, and thus putatively older, than both the E-M84 and E-M123 haplotypes from haplozone, and that in itself is quite interesting.

UPDATE4 (11/29/2012) -Analyzing Ethiopian J-M267 haplotypes.

Similar to the above I used the 48 J-M267 haplotypes from this paper to compare them with non-Ethiopian J-M267 haplotypes from the FTDNA projects database and the results were as follows:


Dataset:J-M267_Plaster
Sample size:48
Years/Generation:28 - 33
TMRCA Range:12188 - 21364
Mean TMRCA:15006
Median TMRCA:14448
SD:3108

Year/Generation =28 detailed:
Finalsummary =

{
  [1,1] = Chandler;14 Markers  TMRCA(Median)--18128 TMRCA(Modal)--18128
  [1,2] = Stafford;14 Markers  TMRCA(Median)--12460 TMRCA(Modal)--12460
  [1,3] = Burgarella_Navascues;14 Markers  TMRCA(Median)--12331 TMRCA(Modal)--12331
  [1,4] = Ballantyne;14 Markers  TMRCA(Median)--12189 TMRCA(Modal)--12189
}

Dataset:J-M267_FTDNA
Sample size:573
Years/Generation:28 - 33
TMRCA Range:11288 - 31985
Mean TMRCA:17597
Median TMRCA:16324
SD:5654

Year/Generation =28 detailed:
finalsummary =

{
  [1,1] = Chandler;14 Markers  TMRCA(Median)--18873 TMRCA(Modal)--27139
  [1,2] = Stafford;14 Markers  TMRCA(Median)--11955 TMRCA(Modal)--16285
  [1,3] = Burgarella_Navascues;14 Markers  TMRCA(Median)--11289 TMRCA(Modal)--15253
  [1,4] = Ballantyne;14 Markers  TMRCA(Median)--12084 TMRCA(Modal)--16363
}

Note again that the 66/46 Marker size mean TMRCA for the FTDNA dataset was considerably lower (9901) than the above 14 marker dataset, again highlighting the impact of Marker combination / size on the absolute TMRCA. However, it is clear from above that the FTDNA J-M267 haplotypes are relatively more diverse than the haplotypes from Ethiopia from the current paper (unlike the case for E-M34 above). 

Another interesting find in this paper with respect to the J-lineage is the reporting of one case of J (x M267, M172) in the Maale, a first such find in Ethiopia that I am aware of.

UPDATE4 (11/30/2012) -Analyzing Ethiopian E-V32 haplotypes.

To finalize the series of TMRCA calculations I have been doing, I performed the same calculations on the E-V32 dataset vs Haplozone, interestingly, it seems as though the E-V32 lineages in Haplozone are older than the ones in the Plaster paper, a reasonable explanation for this is that since we already know that E-V32 is for the most part restricted to Eastern Africa (a) most of the Haplozone E-V32 haplotypes, may have relatively recent East African ancestry, a possibility since a reasonable majority of the haplotypes are from the Arabian peninsula and the near east and/or (b) We know that there are already a few East African (Somali) haplotypes within the E-V32_Haplozone dataset. (Note: the self declared origins of the E-V32 Haplotypes from haplozone were:
11 from the Near East (Qatar, UAE, Jordan, Saudi and Yemen), 2 from Africa (Egypt and Somalia) and 4 of unknown origin).

Here below is the summary for the TMRCA comparisons I have done thus far, each bar within each dataset represents the mean TMRCA when the years per generation is equal to 28 and 33 , and the putative ancestral haplotype is set to median and modal repeats for the specified mutation rate set.

Also, note that the 72 E-M35_Plaster haplotypes are a composite of 18 E-V32, 4 E-V22, 23 E-M34, 1 E-M281 and 26 E-V6 haplotypes. Whereas the 180 E-M35_Haplozone haplotypes are a composite of, 20 E-V13, 20 E-V22, 20 E-V12, 60 E-M81 and 60 E-M123 haplotypes. 


National Geographic fesses up on the origin of E-M35

$
0
0
In their second phase of the massive global scale genetic testing project, Geno 2.0: The Greatest Journey Ever Told, National Geographic has finally fessed up to the most parsimonious explanation to the origin of YDNA haplogroup E1b1b1, this is good news, even if it took 8 years to do so, i.e. about 8 years after the publishing of the first detailed paper on E-M35.

In the first phase of the Geneographic project, launched in 2005, E-M35's origin was explictly stated as the following (unfortunately I don't have the old screen shot):

"The man who gave rise to marker M35 was born around 20,000 years ago in the Middle East. His descendants were among the first farmers and helped spread agriculture from the Middle East into the Mediterranean region."

You can read what it reads today in the screen shot below:

There is also the sentence, "Today, in keeping with its place of origin, this line is common among Afro-Asiatic speakers", could the part, 'in keeping with its place of origin', be also a 'nudge' at the very distinct,  and in my opinion, strong, possibility that Afroasiatic may have originated in East Africa as well ?
If so, this would be a first for a major outlet like Nat Geo and others, even though, renowned Afroasiatic experts like Greenberg, Ehret, Blench et. al had said this for decades.

Ramesses III belonged to YDNA haplogroup E1b1a

$
0
0

According to a study published yesterday, Revisiting the harem conspiracy and death of Ramesses III: anthropological, forensic, radiological, and genetic study, Y- STR data places his YDNA haplogroup in E1b1a using Whit Athey's Haplogroup predictor: 

"Genetic kinship analyses revealed identical haplotypes in both mummies (table 1); using the Whit Athey’s haplogroup predictor, we determined the Y chromosomal haplogroup E1b1a. "


his DYS repeats are listed as follows:

DYS 44820
DYS 43810
DYS 43714
YGATAH413
DYS 39217
DYS 3918
DYS 3938
DYS 385a,b20
DYS 1919
DYS 389II33
DYS 39021
DYS 389I13
DYS 45613


Plugging these numbers in Whit Athey's predictor does indeed indicate that his haplogroup is E1b1a with 99.1% probability using equal priors. The decisive DYS, to judge between E1b1a and E1b1b, is DYS 390, with the exclusion of DYS 390, his haplotype belongs to 83.7 % E1b1b and 15.8% E1b1a, however, it is well known that DYS 390 = 21 is a high probability signature for West/Central/Southern Africa, i.e. where E1b1a dominates (see below).


TMRCA calculations from Plaster NRY data : Correcting an Error

$
0
0

Previously, I had computed TMRCAs for the YDNA STR data from the additional material that was provided along with Dr.Chris Plaster's thesis. However, after a brief communication with the author, I found out that the marker order of the STRs in the excel file was reported wrongly, the correct order for the markers are thus as follows:

DYS19 DYS388 DYS389I DYS389II DYS390 DYS391 DYS392 DYS393 DYS437 DYS438 DYS439 DYS448 DYS456 DYS635 Y GATA H4

This changes my TMRCA calculations because I am not computing the coalescent using a generic mutation rate that is equivalent for all the markers, but rather each marker has its own mutation rate attributed to it.

When I rerun my program using the newly corrected order above I get the following:


As can be seen, using the new order of markers generally reduces the number of generations to coalescent for the Plaster data-set. The previous observation of a relatively lower TMRCA for the haplozone data of E-M123 versus that of the E-M34 Plaster data-set largely disappears. 

To check if the fact that the high number of samples (129) present in the E-M123 haplozone data-set was skewing the results, I took 23 random samples (which equals the same number of samples available in the Plaster E-M34 data-set) from the larger E-M123 Haplozone dataset and re-run the TMRCA calculations on just those samples, I repeated this process 300 times, only 28% of the runs yielded a mean TMRCA less than the E-M34 Plaster data-set, if sample size was skewing the results I would expect >50% of the runs to have a mean TMRCA less than that of the E-M34 plaster dataset.

That said, the E-M34 Plaster data-set still had a relatively higher generations to coalescent than the E-M84 Haplozone dataset, E-M84 is a subclade of E-M34 and a high majority of haplotypes that belong to E-M34 also test positive for the E-M84 SNP (at least for the non-African E-M34 haplotypes that we know of).

Other than that, the new, and corrected, ordering of the markers did not have much impact in relative TMRCA terms between the Plaster and Haplozone/FTDNA data for the other lineages I had tested.

East African mtDNA variation has implications on the origin of Afroasiatic

$
0
0
The Dienekes' Anthropology Blog shows a new paper on East African mtDNA with implications for the origin of Afroasiatic, namely with the citing:"making the hypothesis of a Levantine origin of AA unlikely",  unfortunately I do not have access to the paper, I would greatly appreciate if anyone has access to it to please send me a copy here: ethiohelix@gmail.com.

Here is the abstract and the link:


Abstract

East Africa (EA) has witnessed pivotal steps in the history of human evolution. Due to its high environmental and cultural variability, and to the long-term human presence there, the genetic structure of modern EA populations is one of the most complicated puzzles in human diversity worldwide. Similarly, the widespread Afro-Asiatic (AA) linguistic phylum reaches its highest levels of internal differentiation in EA. To disentangle this complex ethno-linguistic pattern, we studied mtDNA variability in 1,671 individuals (452 of which were newly typed) from 30 EA populations and compared our data with those from 40 populations (2970 individuals) from Central and Northern Africa and the Levant, affiliated to the AA phylum. The genetic structure of the studied populations—explored using spatial Principal Component Analysis and Model-based clustering—turned out to be composed of four clusters, each with different geographic distribution and/or linguistic affiliation, and signaling different population events in the history of the region. One cluster is widespread in Ethiopia, where it is associated with different AA-speaking populations, and shows shared ancestry with Semitic-speaking groups from Yemen and Egypt and AA-Chadic-speaking groups from Central Africa. Two clusters included populations from Southern Ethiopia, Kenya and Tanzania. Despite high and recent gene-flow (Bantu, Nilo-Saharan pastoralists), one of them is associated with a more ancient AA-Cushitic stratum. Most North-African and Levantine populations (AA-Berber, AA-Semitic) were grouped in a fourth and more differentiated cluster. We therefore conclude that EA genetic variability, although heavily influenced by migration processes, conserves traces of more ancient strata. Am J Phys Anthropol, 2013. © 2013 Wiley Periodicals, Inc.

mtDNA variation in East Africa unravels the history of afro-asiatic groups

UPDATE: Ok, got it, this was a nice little article to read, however with respect to the implications of East African mtDNA variation on the origin of Afroasiatic, it did not offer nothing really substantially new, in terms of material evidence, that any reasonable person that has read up on this subject a little bit would not have known beforehand, namely:


Concerning the third point, i.e., the place of origin of AA (EA or the Levant), our results do not allow us to make conclusive statements. Indeed, coalescent simulations of different genetic parameters (Supporting Information Fig. 4) according to the two mentioned hypotheses show that—even assuming complete correlation between languages and mtDNA variability—their confidence intervals largely overlap. Thus, we limit ourselves to the following observations. First, EA shows the highest levels of nucleotide diversity among the studied populations with a decreasing cline towards NA and the Levant (Supporting Information Fig. 1 and Supporting Information Table 1). This is true not only for the Ethiopian cluster A, but also, and especially, for groups belonging to clusters B1 and B2. Second, EA hosts the two deepest clades of AA, Omotic and Cushitic. These families are found exclusively in EA, while the presence of Semitic in this area is much more recent. Third, cluster C – collecting Berber- and Semitic-speaking populations from NA and the Levant – shows only modest signals of admixture with clusters A and B (Fig. 2, Supporting Information Table 1). None of these points,
taken by itself, is conclusive, but undoubtedly the hypothesis of origin of AA in EA is the most parsimonious one, if compared to the Levant.

It did also have some very nicely made contour maps for EA, as well as detailed mtDNA haplogroup assignments for some 30 or so East African groups, which I will make an interactive chart for within the next couple of days.

UPDATE2 (01/08/2013): mtDNA haplogroups (46) in 31 groups.

A note on the sources for the samples listed above:


The Dinka Samples are from Krings etal. (1999)
The Sudan and Ethiopia Samples are from Soares et al. (2011)
The Tigrai, Amhara, Gurage, Oromo and Yemeni1 Samples are from Kivisild et al. (2004)
The Beta Israel Samples are from Beharet al. (2008)
The Ethiopian Jewish Samples are from Non et al. (2011)
The Somali Samples are from Soares et al. (2011) and Watson et al. (1997)
The Daasanach and Nyangatom Samples are from Poloni et al. (2009)
The Turkana2 Samples are from Poloni et al. (2009) and Watson et al. (1997)
The Nairobi Samples are from Brandstatter et al. (2004)
The Kikuyu Samples are from Watson et al. (1997)
The Hutu Samples are from Castrì etal. (2009)
The Iraqw Samples are from Knight etal. (2003)
The Burunge and Turu Samples are from Tishkoff et al. (2007)
The Datoga and Sukuma Samples are from Tishkoff et al. (2007) and Knight etal. (2003)

All the remaining samples: Dawro Konta, Ongota, Hamer, Rendille, Elmolo, Luo, Maasai, Samburu and Turkana are new and sampled along with this study.

A speculative superimposition of E-M35 variants onto Afroasiatic.

$
0
0
Here is a speculative superimposition of the variants of YDNA E-M215/M35 (E1b1b/1) onto an Afroasiatic internal classification, Lionel Bender's (1997) classification. 


The red question marks represent a less unsure fit.

Sudan YDNA

$
0
0
This is from a relatively old study, but it seems that it is the most comprehensive YDNA breakdown we have of North and South Sudan to date.

Y-chromosome variation among Sudanese: restricted gene flow, concordance with language, geography, and history. Hassan (2008)

Here is a map of the populations tested from Fig.1 of the Study
Populations Studied

Here below is the phylogeny (as known back in 2008) of the SNPs tested, note that those in bold; E-M75, E-P2, G-M201 and T-M70 were NOT tested in the study.

SNPs tested (except those in bold)
The E-M78+ cases from above were also tested for Cruciani's V-Series SNPs as well for further resolution,


Cruciani's V-Series SNPs (2007)

Some notes:


  • The high level (38%) of E-M215 (x M78) in the Borgu is quite intriguing, I wonder what variant/s of E-M215 it is?
  • Almost all the J-12f2(x M172) should be J-M267.
  • B-M60 is found in Southern Nilo-Saharan speakers and not the North Western ones, while A-M13 is found in both.
  • The F-M89(x M52,M170,I2f2, M9) found in the north is also interesting, although it could possibly be G-M201, at least part of it.
  • E-V22 has a relatively high presence in these samples, even when compared to the Egyptian samples from Cruciani '07, and most certainly higher than its presence in Ethiopia.
  • The High presence of E-V12 (x V32) is also concordant with its putative area of origin, all the E-M78 found in the Nuer and the Copts is of this variety.
  • The presence of E-M78* in the Masalit and the Nuba is notable.
  • Off course the strangest result is the 54% R-M173 (x P25) in the Fulani, this could be some R1b*(R-M343), or some type of R1a, the latter would be very out of place for the region, while the former could be reconciled with the presence of more downstream R1b variants in Africa. 


Gradient Maps for African ADMIXTURE components

$
0
0
Here below are gradient maps for my last African ADMIXTURE run, Africa_V2b, courtesy of a demo download of Mapviewer7 . The Kriging method was used for Gridding and 'Grid Z limits' mode was used for color mapping.

Sampled Population's Index

Sampled Population's Location

PCA for the FST distances
generated by ADMIXTURE 

West-Africa Cluster Freq.

Nilo-Saharan Cluster Freq.

East-Africa-2 Cluster Freq.

North-Africa Cluster Freq.

Khoi-San Cluster Freq.

Omotic Cluster Freq.

Mbuti-Pygmy Cluster Freq.

Biaka-Pygmy Cluster Freq.

Hadza Cluster Freq.

East-Africa-1 Cluster Freq.
Isometric view of the MDS plot
 for all Populations sampled


UPDATE (02/18/2013) : Below are gradient maps for the first African ADMIXTURE run, Africa_V1, courtesy of a demo download of Mapviewer7 . The same options as above were used both for gridding and color mapping.


Sampled Population's Index

Sampled Population's Location

PCA for the FST distances 
generated by ADMIXTURE  

Central-West-Africa Cluster Freq.

North-Africa Cluster Freq.

Eastern-Bantu  Cluster Freq.

West-Africa Cluster Freq.

East-Africa-2 Cluster Freq.

Khoi-San Cluster Freq.

Mbuti-Pygmy Cluster Freq.

Biaka-Pygmy Cluster Freq.

Hadza Cluster Freq.

East-Africa-1 Cluster Freq.

Isometric view of the MDS plot
 for all Populations sampled

The Zhivotovsky Multiplier

$
0
0

It is reported that Zhivotovsky's effective mutation rate [1] has the effect of increasing the TMRCA of a lineage, as computed by the use of Microsattelite Genetic Distances[2], by a factor of 3-4 fold relative to TMRCAs computed via mutation rates observed in pedigree and family studies [3].

By utilizing my TMRCA calculating program, I want to explore,
  1. What effect does different marker combinations have on this multiplier ?
  2. What effect does marker size have on this multiplier ?
  3. Is there a variation in this multiplier for different data-sets?

First, to ensure that my program correctly calculates the TMRCA when the Zhivotovsky mutation rate of 0.00069 is applied to all the markers in my database consistently (versus only the marker specific Pedigree mutation rates I have thus far been utilizing), I attempted to replicate the TMRCA computations of the following publication;


One reason I chose this article, in addition to it using Zhivotovsky's effective mutation rate, is because it had the most complete STR profiles supplied along with the paper. The article states the following:

The following eight loci, DYS19, DYS389I, DYS389II, DYS390, DYS391, DYS392, DYS393 and DYS439, were used to estimate expansion times using the methodology described by Zhivotovsky et al.21as modified according to Sengupta et al. A microsatellite evolutionary effective mutation rate of 6.9 × 10⁻⁴ was used.

All the eight loci that are mentioned above are available in my program's database, in addition, the modification with respect to Sengupta et al. it is referring to is (1) using the Median repeats for the ancestral haplotype instead of Modal repeats, which is fine since my program computes for both scenarios separately (2) Modification in the computation of the lower/upper bound estimates, which is not necessary for my particular case here, as I am only interested in the central estimates of TMRCA (at least for now, although it would be interesting to see what impact would be seen when the upper/lower bound are estimated according to effective vs. pedigree rates).


The full Chiraoni et al.(2009) J-P58 STR data can be downloaded from the “Supplementary info section”

After importing the data and tweaking the following 17 haplotypes that had contained null values for one or more markers: [xEJ_C5, J1_E1, J1_H5, st_2164, st_2149, J1_C2, Tanta100, 2, 44, 59, 82, 115, 117, 147, 148, 158, 170] by replacing the missing ones with the modal repeats for the entire data-set,  I ended up with 453 J-P58 haplotypes, same as reported in Table 1. When I ran these haplotypes in my program I get;

Dataset:J1e_Chiaroni2
Marker list:8_Chiaronimarkerlist
Sample size:453

Pedigree/Familial Rates Summary
Years/Generation:28 - 33
TMRCA Range:2648 - 4057
Mean TMRCA:3382
Median TMRCA:3368
SD:444

Coalescent_Detail =

{
[1,1] = Chandler;8 Markers Generations(Median)--122.94 Generations(Modal)--122.94
[1,2] = Stafford;8 Markers Generations(Median)--108.45 Generations(Modal)--108.45
[1,3] = Burgarella_Navascues;8 Markers Generations(Median)--117.65 Generations(Modal)--117.65
[1,4] = Ballantyne;8 Markers Generations(Median)--94.601 Generations(Modal)--94.601
[1,5] = Zhivotovsky;8 Markers Generations(Median)--401.11 Generations(Modal)--401.11
}

Since Zhivotovsky is using 25 Years/Generation , this would mean 401.11 X 25 = 10,027.75 years ago for the TMRCA of the J-P58 haplotypes according to my program, the study reports a central estimate of 10, 100 years ago for the same haplotypes, thus my program is correct within 0.7% or less than 3 generations, part of the error could be with how I tweaked those 17 haplotypes that I mentioned above.

To double check, I retested my program with the J1e-YCAII 22/22 haplotypes (a subset of the J-P58 haplotypes from above), however, I could only retrieve 202 of these haplotypes, versus the 203 they are reporting in Table 1. In any event, for those particular haplotypes, I get the following results:

Dataset:J1e_Chiaroni2_YCAII22_22
Marker list:8_Chiaronimarkerlist
Sample size:202

Pedigree/Familial Rates Summary
Years/Generation:28 - 33
TMRCA Range:2260 - 3574
Mean TMRCA:2921
Median TMRCA:2946
SD:415

Coalescent_Detail =

{
[1,1] = Chandler;8 Markers Generations(Median)--108.31 Generations(Modal)--108.31
[1,2] = Stafford;8 Markers Generations(Median)--91.632 Generations(Modal)--91.632
[1,3] = Burgarella_Navascues;8 Markers Generations(Median)--102.45 Generations(Modal)--102.45
[1,4] = Ballantyne;8 Markers Generations(Median)--80.719 Generations(Modal)--80.719
[1,5] = Zhivotovsky;8 Markers Generations(Median)--365.91 Generations(Modal)--365.91
}

Again, for 25 years/generation, this comes out to 365.91 X 25 = 9,147.75, which is off by 0.6% or slightly more than 2 generations from the central estimate that they report for those same haplotypes in Table 1.

I additionally also used the 8 markers from the publication above to compute TMRCAs for E1b1b and J-P58 STR data from FTDNA to get the following results:


Dataset:J1c3
Marker list:8_Chiaronimarkerlist
Sample size:256

Pedigree/Familial Rates Summary
Years/Generation:28 - 33
TMRCA Range:3636 - 5604
Mean TMRCA:4810
Median TMRCA:4752
SD:659

Coalescent_Detail =

{
[1,1] = Chandler;8 Markers Generations(Median)--169.6 Generations(Modal)--169.6
[1,2] = Stafford;8 Markers Generations(Median)--161.59 Generations(Modal)--161.59
[1,3] = Burgarella_Navascues;8 Markers Generations(Median)--169.85 Generations(Modal)--169.85
[1,4] = Ballantyne;8 Markers Generations(Median)--129.86 Generations(Modal)--129.86
[1,5] = Zhivotovsky;8 Markers Generations(Median)--467.05 Generations(Modal)--467.05
}

Dataset:EM35-Balanced
Marker list:8_Chiaronimarkerlist
Sample size:180

Pedigree/Familial Rates Summary
Years/Generation:28 - 33
TMRCA Range:5678 - 8101
Mean TMRCA:6713
Median TMRCA:6782
SD:756

Coalescent_Detail =

{
[1,1] = Chandler;8 Markers Generations(Median)--245.49 Generations(Modal)--245.49
[1,2] = Stafford;8 Markers Generations(Median)--219.22 Generations(Modal)--219.22
[1,3] = Burgarella_Navascues;8 Markers Generations(Median)--212.94 Generations(Modal)--212.94
[1,4] = Ballantyne;8 Markers Generations(Median)--202.79 Generations(Modal)--202.79
[1,5] = Zhivotovsky;8 Markers Generations(Median)--801.13 Generations(Modal)--801.13
}

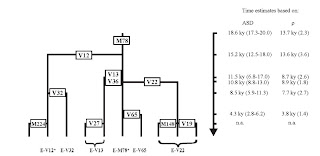
Above, we can see that while the FTDNA J-P58 data-set seems older by ~66 generations (for the Zhivotovsky rates) than the Chiaroni (2009) dataset, it is interesting to note that the E1b1b1 dataset's results of 801 generations or 20.028 KYA is quite close to the lower bound of Cruciani (2007)'s TMRCA estimate of 20.9-23.9 KYA.

Now that I have verified the program works reasonably well with the effective mutation rate that I added to the database, I can now test what the effect of marker combination/size has, on not only the absolute TMRCA estimates, but on the Zhivotovsky multiplier as well.

To do this, I utilized 2 of the FTDNA datasets I used above for E-M35 and J-P58. Since I have a maximum of 49 markers to work with, I simply took a random subset of those 49 markers for computation of both the Zhivotovsky and the Pedigree coalescent estimates, since the main purpose is to find the effect of marker combination, I then repeat the process of extracting random combinations from within the super-set of 49 markers and performing the computations, thus, I repeated the process of extracting said combinations a total of 50 times per chosen marker size.

For instance, if I choose my first marker size to be 8, I would then compute TMRCAs for 50 separate random 8 marker combinations within the dataset. Then, I double the marker size and compute TMRCAs for another 50 random combinations and so forth, until I reach my marker size limit.

Starting with a marker size of 8, and then going to 16, 32 and 40, here below are the results for the E-M35 and J-P58 datasets with 50 random combinations for each marker size.

Note that in the tables below, Z-TMRCA, denotes the TMRCA in generations obtained using the effective mutation rate while P-TMRCA denotes an average of the TMRCAs obtained from the 4 separate sources that utilize the pedigree rates in my program. The  X Max, X Min, X Average and X SD, denote respectively the maximum, minimum, average and standard deviation of the Zhivotovsky multiple found for each combination run. All columns of the tables are sortable.


8 Marker – E-M35_FTDNA


16 Marker – E-M35_FTDNA


32 Marker – E-M35_FTDNA


40 Marker – E-M35_FTDNA


8 Marker – J-P58_FTDNA


16 Marker – J-P58_FTDNA


32 Marker – J-P58_FTDNA


40 Marker – J-P58_FTDNA


From the tables above, it is clear that the Zhivotovsky multiple has wide ranges depending on the marker combination (as well as which pedigree rates are used), but it can also be seen that the ranges narrow down when marker size is increased. 

For instance, for the E-M35 dataset with a marker size of 8, the minimum multiple is 0.71 (below parity !) and is found at Combo # 6, while the maximum multiple is 9.67 found at Combo # 34, this gives a multiple range of 8.96, for the same dataset, but however for a marker size of 40, the minimum multiple is 2.15 (Combo # 29) while the maximum multiple is 5.41 (Combo # 28), giving a multiple range of 3.26, which is almost a 64% reduction in the range of the multiple going from the smallest to the largest marker size. A similar pattern of a range reduction in the multiple can also be seen with the other dataset (J-P58).

The above could be explained by either 1 of 2 reasons that need further testing, (1) As the marker size increases the pool of newly available markers to combine randomly also gets limited, as there are ultimately only 49 markers to work with, thus the results become more of a repetition or (2) Marker size increase really does have a significant effect on the range of the multiple.


Whatever the case, it is clear that marker combination has a tremendous effect on the Zhivotovsky multiple, more especially if the markers used are low in size, therefore, the 'mantra' of multiply by 3 (or divide by 3) while true on average, is a gross oversimplification, or even completely wrong, if the particular combination of marker properties along with the particular set of pedigree mutation rates used are not accounted for in detail.

Although more data-points than only the 8, 16, 32 and 40 marker sizes that I used would certainly be ideal, there was no particular correlation between the marker sizes and the absolute TMRCA's generated for both the Pedigree and Zhivotovsky rates. 

The E-M35 data-set had an overall mean (for all marker sizes and random combinations) for the Z-TMRCA of 1456 generations with an SD of 70.28, and R^2 of 0.09, while the P-TMRCA had 401, 4.73 and 0.92 respectively for the same variables. The J-P58 dataset had 726, 33.75 and 0.62 respectively for the Z-TMRCA and 235, 16.91 and 0.36 for the P-TMRCA. (see also below)


Geno 2.0 YDNA SNP Pathways.

$
0
0

The Geno 2.0 chip tests some 13,000 SNPs on the Y-Chromosome, by far the largest from all commercial DNA companies, in addition, a lot of these SNPs do not have a place assigned in the YDNA phylogeny, no official phylogeny has been published yet either.

However, the customers of this project get the option to transfer the SNPs to FTDNA and thereby join the numerous grouped projects under the FTDNA umbrella, which then displays the results of which SNPs they tested positive for.

Although we don't know where most of these SNPs belong on the YDNA tree, we do know where some of them belong, and by utilizing the most rudimentary operations of set mathematics (union, intersection and set difference), in addition to the positions of the known SNPs in the current YDNA phylogeny tree (ISOGG 2013) it is possible to segregate these SNPs that appear on the project pages into phylogenetic pathways.

This posting will change frequently as more and more kits appear in the FTDNA project pages.

The first thing to realize is that the following list of 101 SNPs are either erroneous or erroneously reported and need to be discarded if they appear on any of the results until FTDNA , NATGEO or whoever else is responsible fixes them,

CTS1034+ CTS10436+ CTS10713+ CTS10738+ CTS11085+ CTS11454+ CTS11844+ CTS12173+ CTS2080+ CTS2223+ CTS230+ CTS2447+ CTS295+ CTS3234+ CTS335+ CTS3647+ CTS3763+ CTS3914+ CTS4276+ CTS4623+ CTS4714+ CTS477+ CTS5458+ CTS5580+ CTS6010+ CTS6353+ CTS6384+ CTS6891+ CTS7453+ CTS7492+ CTS7859+ CTS7951+ CTS8133+ CTS8178+ CTS8244+ CTS9096+ CTS947+ CTS9512+ CTS9548+ F1173+ F1221+ F1300+ F1327+ F1369+ F1707+ F1754+ F1831+ F1833+ F1842+ F1870+ F1882+ F2000+ F2137+ F2150+ F2177+ F2223+ F2494+ F2503+ F2546+ F2631+ F2845+ F2887+ F2932+ F3035+ F3039+ F317+ F3187+ F3225+ F3394+ F3397+ F3455+ F375+ F3948+ F3965+ F4131+ F4277+ F830+ F842+ F869+ F889+ F910+ F942+ F943+ F969+ L366+ L477+ L493+ L515+ L516+ L517+ L552+ L594+ M263+ PF4208+ PF4330+ PF5061+ PF6868+ PF7392+ Z148+ Z191+ Z365+  


Notes : Unions will be listed without symbol, ex Set ABC = Set ( (A  B) ∪ C)
            Known SNP identification is all based on ISOGG 2013 only.


Pathway from root to CT-M168 (=Set # A)


Binary Operation: Set1 Set2

Number of SNPs: 77


CTS10362+ CTS109+ CTS11358+ CTS11575+ CTS125+ CTS1996+ CTS3331+ CTS3431+ CTS3662+ CTS4364+ CTS4368+ CTS4740+ CTS5318+ CTS5457+ CTS5532+ CTS6383+ CTS6800+ CTS6907+ CTS7922+ CTS7933+ CTS8243+ CTS8980+ CTS9828+ L566+ L781+M139+M168+M294+M42+M94+ PF1016+ PF1029+ PF1031+ PF1040+ PF1046+ PF1061+ PF1092+ PF1097+ PF110+ PF1203+ PF1269+ PF1276+ PF15+ PF192+ PF210+ PF212+ PF223+ PF234+ PF258+ PF263+ PF272+ PF278+ PF292+ PF316+ PF325+ PF342+ PF500+ PF601+ PF667+ PF719+ PF720+ PF725+ PF779+ PF796+ PF803+ PF815+ PF821+ PF840+ PF844+ PF892+ PF937+ PF951+ PF954+ PF970+ V189+ V52+ V9+

Identified as same level as BT
Identified as same level as CT-M168
Identified as same level as P <---- Looks unreliable and maybe a false positive report.


Pathway from CT-M168 to DE (YAP+) (=Set # B)


Binary Operation: (Set1 ∩ Set2) \ (Set # A)

Number of SNPs: 16

CTS101+ CTS10714+ CTS3334+ F1977+ F3170+ F3195+ F986+ M145+M203+P144+ P153+ P165+ P183+ PF1427+ PF1442+ PF1455+

Identified as same level as DE (YAP+)


Pathway from DE (YAP+) to E-P2 (=Set # C)


Set2: Kit # N65401, E-M34+

Binary Operation: (Set1 ∩ Set2) \ (Set # A B)

Number of SNPs: 102

CTS10296+ CTS1075+ CTS119+ CTS124+ CTS1446+ CTS1545+ CTS1978+ CTS2150+ CTS3250+ CTS3262+ CTS4685+ CTS5316+ CTS5373+ CTS5404+ CTS6333+ CTS6513+ CTS6842+ CTS7913+ CTS8053+ CTS8432+ CTS8900+ CTS8947+ F1365+ L489+ L499+ L504+ L507+ L510+ L512+ L537+ L614+ M96+P147+P150+ P152+ P155+ P162+ P169+ P171+ P172+ P173+ P175+ P176+P177+P179+ P180+ P181+ P2+P29+ PF1456+ PF1459+ PF1462+ PF1467+ PF1468+ PF1472+ PF1473+ PF1476+ PF1477+ PF1480+ PF1485+ PF1486+ PF1489+ PF1490+ PF1494+ PF1495+ PF1500+ PF1501+ PF1535+ PF1536+ PF1545+ PF1547+ PF1548+ PF1550+ PF1551+ PF1552+ PF1553+ PF1554+ PF1555+ PF1557+ PF1559+ PF1561+ PF1563+ PF1564+ PF1565+ PF1567+ PF1576+ PF1583+ PF1593+ PF1608+ PF1610+ PF1618+ PF1795+ PF1796+ PF1798+ PF1799+ PF1809+ PF1819+ PF1822+ PF1827+ PF1828+ PF1873+ PF1927+

Identified as same level as E-M96
Identified as same level as E1
Identified as same level as E1b
Identified as same level as E-P2


Pathway from E-P2 to E-M215/M35 (=Set # D)


Binary Operation: (Set1 ∩ Set2)  \  Set # ABC

Number of SNPs: 87

CTS10184+ CTS10513+ CTS10637+ CTS10679+ CTS1389+ CTS2216+ CTS225+ CTS2474+ CTS2591+ CTS2620+ CTS3512+ CTS3637+ CTS3988+ CTS4220+ CTS4856+ CTS5530+ CTS5792+ CTS6298+ CTS6809+ CTS6834+ CTS6953+ CTS7154+ CTS7677+ CTS7980+ CTS8033+ CTS8131+ CTS8479+ CTS8586+ CTS890+ CTS8945+ CTS9017+ CTS9049+ CTS9324+ CTS9956+ L117+ L336+ L538+ L545+ L676+ L796+ M215+M243+ P170+ PF1454+ PF1457+ PF1466+ PF1471+ PF1484+ PF1487+ PF1492+ PF1499+ PF1531+ PF1532+ PF1534+ PF1537+ PF1538+ PF1540+ PF1542+ PF1543+ PF1560+ PF1566+ PF1569+ PF1570+ PF1571+ PF1572+ PF1574+ PF1575+ PF1598+ PF1619+ PF1755+ PF1793+ PF1801+ PF1807+ PF1812+ PF1813+ PF1818+ PF1820+ PF1826+ PF1830+ PF1831+ PF1832+ PF1835+ PF1836+ PF1871+ PF1909+ PF1913+ PF1929+

Identified as same level as E-M215
Identified as same level as E-M35


Pathway from E-M215/35 to E-Z827 (=Set # J)

Binary Operation: (Set1 ∩ Set2)  \  Set # ABCD

Number of SNPs: 1

Z827+

Identified as same level as E-Z827


Pathway from E-M215/35 to E-M78 (=Set # K)

Binary Operation: (Set1 ∩ Set2)  \  Set # ABCD

Number of SNPs: 52

CTS10323+ CTS10617+ CTS11082+ CTS11310+ CTS2270+ CTS2661+ CTS3278+ CTS4208+ CTS5561+ CTS5697+ CTS58+ CTS675+ CTS7166+ CTS7924+ CTS8002+ CTS8899+ F1244+ L539+ L541+ L544+ L546+ L547+ M78+ PF1956+ PF2098+ PF2107+ PF2108+ PF2109+ PF2110+ PF2111+ PF2112+ PF2113+ PF2114+ PF2115+ PF2117+ PF2118+ PF2119+ PF2122+ PF2124+ PF2147+ PF2173+ PF2175+ PF2176+ PF2177+ PF2178+ PF2179+ PF2181+ PF2182+ PF2185+ PF2188+ PF2202+ V68+

Identified as same level as E-V68
Identified as same level as E-M78


Pathway from E-P2 to E-M180 (=Set # E)


Binary Operation: (Set1 ∩ Set2)  \  Set # ABC

Number of SNPs: 68


CTS1001+ CTS10066+ CTS10638+ CTS10659+ CTS10806+ CTS10914+ CTS11461+ CTS11557+ CTS11579+ CTS11729+ CTS11732+ CTS12659+ CTS1847+ CTS1878+ CTS2075+ CTS224+ CTS3105+ CTS3259+ CTS3299+ CTS3344+ CTS3425+ CTS3576+ CTS3989+ CTS4054+ CTS4350+ CTS4408+ CTS5042+ CTS5539+ CTS5572+ CTS5629+ CTS6180+ CTS6302+ CTS6319+ CTS6474+ CTS7095+ CTS7282+ CTS7454+ CTS7641+ CTS8068+ CTS8123+ CTS8443+ CTS8562+ CTS8936+ CTS9188+ CTS9338+ CTS9768+ CTS9978+ L432+ L433+ L488+ L491+ L494+ L501+ L608+ L610+ L86+ L88+ M180+M2+M291+P1+P182+P293+ PAGES00066+ PAGES00106+ V100+ V38+V43+


Identified as same level as E-V38
Identified as same level as E-M2
Identified as same level as E-M180


Pathway from CT-M168 to CF-P143

Binary Operation: (Set1 ∩ Set2)  \  Set # A

Number of SNPs: 0


No SNPs were found that met the criteria, P143 is also not directly tested by the geno chip, a possible explanation is that one or more of the erroneous SNPs listed above could potentially meet the criteria, will have to wait till they get fixed.


Pathway from CF-P143 to F-M89 (=Set # F)

Binary Operation: (Set1 ∩ Set2)  \  Set # A

Number of SNPs: 72


CTS11726+ CTS12632+ CTS3536+ CTS3654+ CTS3868+ CTS3996+ CTS4443+ CTS6135+ F1046+ F1209+ F1302+ F1320+ F1329+ F1704+ F1714+ F1753+ F1767+ F2048+ F2075+ F2142+ F2155+ F2402+ F2587+ F2688+ F2710+ F2837+ F2985+ F2993+ F3111+ F3136+ F3335+ F3556+ F3692+ F719+ L132+ L350+ L468+ L470+ L498+ M235+ M89+ P135+ P136+ P138+ P14+ P141+ P145+ P146+ P148+ P151+ P158+ P159+ P160+ P166+ P187+ PF2591+ PF2593+ PF2599+ PF2600+ PF2608+ PF2611+ PF2615+ PF2624+ PF2631+ PF2643+ PF2745+ PF2747+ PF2748+ PF2749+ PF2770+ V186+ V205+

Identified as same level as F-M89


Pathway from F-M89  to IJK (=Set # G)

Binary Operation: (Set1 ∩ Set2)  \  Set # AF

Number of SNPs: 2


 L15+ L16+

Identified as same level as IJK


Pathway from IJK to IJ (=Set # H)

Binary Operation: (Set1 ∩ Set2)  \  Set # AFG

Number of SNPs: 29

 CTS6932+ CTS9240+ F1450+ F1460+ F2345+ F2366+ F2794+ F3368+ F3402+ F4188+ F922+ L403+ L748+P123+ P124+ P126+ P127+P130+ PF3504+ PF3514+ PF3515+ PF3517+ PF3518+ PF3534+ PF3560+ PF3561+ PF3562+ YSC0000056+ YSC0000265+

Identified as same level as IJ


Pathway from IJ to J-M304 (=Set # I)

Binary Operation: (Set1 ∩ Set2)  \  Set # AFGH

Number of SNPs: 55

CTS1068+    CTS10858+ CTS11571+ CTS11765+ CTS11787+ CTS12047+ CTS2769+ CTS3936+ CTS5280+ CTS5628+ CTS7738+ CTS852+ CTS8938+ F1167+ F1181+ F1634+ F1744+ F2116+ F2174+ F2276+ F2390+ F2502+ F2746+ F2749+ F2769+ F2817+ F2839+ F2973+ F3074+ F3119+ F3347+ F3358+ F3384+ F4072+L134+ L778+M304+P209+ PF4490+ PF4491+ PF4513+ PF4521+ PF4530+ PF4572+ PF4591+ PF4595+ PF4598+ PF4622+ YSC0000064+ YSC0000066+ YSC0000165+ YSC0000197+ YSC0000228+ YSC0000236+ YSC0000239+

Identified as same level as J-M304

African Sahel YDNA

$
0
0

Multiple and differentiated contributions to the male gene pool of pastoral and farmer populations of the African Sahel


ABSTRACT

The African Sahel is conducive to studies of divergence/admixture genetic events as a result of its population history being so closely related with past climatic changes. Today, it is a place of the co-existence of two differing food-producing subsistence systems, i.e., that of sedentary farmers and nomadic pastoralists, whose populations have likely been formed from several dispersed indigenous hunter-gatherer groups. Using new methodology, we show here that the male gene pool of the extant populations of the African Sahel harbors signatures of multiple and differentiated contributions from different genetic sources. We also show that even if the Fulani pastoralists and their neighboring farmers share high frequencies of four Y chromosome subhaplogroups of E, they have drawn on molecularly differentiated subgroups at different times. These findings, based on combinations of SNP and STR polymorphisms, add to our previous knowledge and highlight the role of differences in the demographic history and displacements of the Sahelian populations as a major factor in the segregation of the Y chromosome lineages in Africa. Interestingly, within the Fulani pastoralist population as a whole, a differentiation of the groups from Niger is characterized by their high presence of R1b-M343 and E1b1b1-M35. Moreover, the R1b-M343 is represented in our dataset exclusively in the Fulani group and our analyses infer a north-to-south African migration route during a recent past.

Closed Access


UPDATE: TMRCA estimates from STR haplotypes of E-M35 (x M78, M81, M123), E-M2, E-M33 and R1b respectively. Farmer and Pastoralist haplotypes were also combined. Markers used for estimates were the following: DYS 19, 388, 389-1, 389-2, 390, 391, 392, 393 and 439.


Dataset:Buckova_EM35*
Marker list:9_Buckovamarkerlist
Sample size:41

Pedigree/Familial Rates Summary
Years/Generation:28 - 33
TMRCA Range:1294 - 2191
Mean TMRCA:1824
Median TMRCA:1854
SD:301

Coalescent_Detail =

{
  [1,1] = Chandler;9 Markers;  Generations(Median)--66.412 Generations(Modal)--66.412
  [1,2] = Stafford;9 Markers;  Generations(Median)--60.508 Generations(Modal)--60.508
  [1,3] = Burgarella_Navascues;9 Markers;  Generations(Median)--66.08 Generations(Modal)--66.08
  [1,4] = Ballantyne;9 Markers;  Generations(Median)--46.216 Generations(Modal)--46.216
  [1,5] = Zhivotovsky;9 Markers;  Generations(Median)--188.52 Generations(Modal)--188.52
}

Dataset:Buckova_EM78
Marker list:9_Buckovamarkerlist
Sample size:22

Pedigree/Familial Rates Summary
Years/Generation:28 - 33
TMRCA Range:20666 - 51129
Mean TMRCA:35091
Median TMRCA:34492
SD:8588

Coalescent_Detail =

{
  [1,1] = Chandler;9 Markers;  Generations(Median)--1238.6 Generations(Modal)--1549.4
  [1,2] = Stafford;9 Markers;  Generations(Median)--1039.6 Generations(Modal)--1376.3
  [1,3] = Burgarella_Navascues;9 Markers;  Generations(Median)--1009 Generations(Modal)--1348.9
  [1,4] = Ballantyne;9 Markers;  Generations(Median)--738.07 Generations(Modal)--904.69
  [1,5] = Zhivotovsky;9 Markers;  Generations(Median)--1573.7 Generations(Modal)--1807.9
}
See Comments below.

Dataset:Buckova_EM2
Marker list:9_Buckovamarkerlist
Sample size:180

Pedigree/Familial Rates Summary
Years/Generation:28 - 33
TMRCA Range:10004 - 19439
Mean TMRCA:14511
Median TMRCA:14437
SD:2662

Coalescent_Detail =

{
  [1,1] = Chandler;9 Markers;  Generations(Median)--561.59 Generations(Modal)--589.07
  [1,2] = Stafford;9 Markers;  Generations(Median)--482.51 Generations(Modal)--504.53
  [1,3] = Burgarella_Navascues;9 Markers;  Generations(Median)--446.88 Generations(Modal)--481.86
  [1,4] = Ballantyne;9 Markers;  Generations(Median)--357.31 Generations(Modal)--382.41
  [1,5] = Zhivotovsky;9 Markers;  Generations(Median)--1001.1 Generations(Modal)--1140.6
}


Dataset:Buckova_EM33
Marker list:9_Buckovamarkerlist
Sample size:60

Pedigree/Familial Rates Summary
Years/Generation:28 - 33
TMRCA Range:11684 - 26171
Mean TMRCA:18035
Median TMRCA:17756
SD:3873

Coalescent_Detail =

{
  [1,1] = Chandler;9 Markers;  Generations(Median)--678.13 Generations(Modal)--793.08
  [1,2] = Stafford;9 Markers;  Generations(Median)--539.26 Generations(Modal)--632.76
  [1,3] = Burgarella_Navascues;9 Markers;  Generations(Median)--532.99 Generations(Modal)--652.5
  [1,4] = Ballantyne;9 Markers;  Generations(Median)--417.31 Generations(Modal)--484.69
  [1,5] = Zhivotovsky;9 Markers;  Generations(Median)--1095 Generations(Modal)--1476.1
}

Dataset:Buckova_R1b
Marker list:9_Buckovamarkerlist
Sample size:15

Pedigree/Familial Rates Summary
Years/Generation:28 - 33
TMRCA Range:8024 - 12844
Mean TMRCA:10650
Median TMRCA:10711
SD:1540

Coalescent_Detail =

{
  [1,1] = Chandler;9 Markers;  Generations(Median)--389.23 Generations(Modal)--389.23
  [1,2] = Stafford;9 Markers;  Generations(Median)--375.88 Generations(Modal)--375.88
  [1,3] = Burgarella_Navascues;9 Markers;  Generations(Median)--345.04 Generations(Modal)--345.04
  [1,4] = Ballantyne;9 Markers;  Generations(Median)--286.6 Generations(Modal)--286.6
  [1,5] = Zhivotovsky;9 Markers;  Generations(Median)--901.77 Generations(Modal)--901.77
}


Global Contour Map for the Dual ADMIXTURE Components.

$
0
0
Below is a contour map representing the African ADMIXTURE component at K=2 for the Global data set (V2) which  can be downloaded here, and population specific percentages that can be seen here

Contour map generated using Mapviewer7, Kriging method was used for gridding. ADMIXTURE outputs for all New World, Jewish, Singapore-Chinese and Singapore-Indian populations were removed before the generation of the map.

African cline from ADMIXTURE, K=2 . Black dots represent locations of sampled populations


 Some things to note,

  • Since this is a K2 run, the OOA or the 'other' component has a complete mirror distribution relative to the distribution of the African component seen in the above.
  • The regions where the brown color dominates (20-35% African ) are the same regions that are later on absorbed by the new component that arises @ K=3, which finds its peaks in West Eurasians and has an FST that is intermediate between those of the African and East Asian/Amerindian components.
  • It is notable to observe the congruence of the above with the distribution of global genetic as well as phenotypic diversity (below)1


Global phenotypic and genetic Diversity 
1.The effect of ancient population bottlenecks on human phenotypic variation

Next-generation sequencing on Egyptian mummies

$
0
0
Nature has a news article out on a paper supposedly published last week in the Journal of Applied Genetics by Khairat, R. et al. which carried out next-generation sequencing on five Egyptian mummified heads, the paper is not accessible, some excerpts from the news article:

The ancient Egyptians could soon be getting their genomes sequenced as a matter of routine. That’s the view, at least, of the first researchers to use next-generation techniques to analyse DNA from Egyptian mummies.....

....Now, Pusch and his colleagues, including Rabab Khairat, have carried out next-generation sequencing on five Egyptian mummified heads held at the University of Tübingen. The heads date from relatively late in ancient Egyptian history — between 806 bc and 124 ad....

....they show that human DNA survives in the mummies and that it is amenable to sequencing...

....The researchers determined that one of the mummified individuals belongs to an ancestral group, or haplogroup, called I2, believed to have originated in Western Asia. They also retrieved genetic material from the pathogens that cause malaria and toxoplasmosis, and from a range of plants that includes fir and pine — both thought to be components of embalming resins — as well as castor, linseed, olive, almond and lotus....

....In mummies, “DNA preservation appears to be independent of temperature,” he says.....

.....Now that Pusch and his colleagues have demonstrated next-generation sequencing in Egyptian mummies, however, moving on to entire genomes “isn’t rocket science”, Gilbert says. “What limits you is the size of a sample. For Denisova Man they had just a finger bone. Here they have the whole mummy.”....

....“entire-genome sequencing of ancient Egyptian individuals is likely to become standard in the not-too-distant future”.....

http://www.nature.com/news/egyptian-mummies-yield-genetic-secrets-1.12793#/b1

Edit: Found link to the Abstract here: Khairat, R. et al.

We applied, for the first time, next-generation sequencing (NGS) technology on Egyptian mummies. Seven NGS datasets obtained from five randomly selected Third Intermediate to Graeco-Roman Egyptian mummies (806 BC–124AD) and two unearthed pre-contact Bolivian lowland skeletons were generated and characterised. The datasets were contrasted to three recently published NGS datasets obtained from cold-climate regions, i.e. the Saqqaq, the Denisova hominid and the Alpine Iceman. Analysis was done using one million reads of each newly generated or published dataset. Blastn and megablast results were analysed using MEGAN software. Distinct NGS results were replicated by specific and sensitive polymerase chain reaction (PCR) protocols in ancient DNA dedicated laboratories. Here, we provide unambiguous identification of authentic DNA in Egyptian mummies. The NGS datasets showed variable contents of endogenous DNA harboured in tissues. Three of five mummies displayed a human DNA proportion comparable to the human read count of the Saqqaq permafrost-preserved specimen. Furthermore, a metagenomic signature unique to mummies was displayed. By applying a “bacterial fingerprint”, discrimination among mummies and other remains from warm areas outside Egypt was possible. Due to the absence of an adequate environment monitoring, a bacterial bloom was identified when analysing different biopsies from the same mummies taken after a lapse of time of 1.5 years. Plant kingdom representation in all mummy datasets was unique and could be partially associated with their use in embalming materials. Finally, NGS data showed the presence of Plasmodium falciparum and Toxoplasma gondii DNA sequences, indicating malaria and toxoplasmosis in these mummies. We demonstrate that endogenous ancient DNA can be extracted from mummies and serve as a proper template for the NGS technique, thus, opening new pathways of investigation for future genome sequencing of ancient Egyptian individuals.

Source code for the ASD based TMRCA calculator (Octave)

$
0
0
The code for the TMRCA calculator of YDNA STR haplotypes that I use can be downloaded from here : https://dl.dropboxusercontent.com/u/42082352/TMRCA_ASD.zip

See also here for instances of where I have used the calculator in the past:
http://ethiohelix.blogspot.com/2012/06/finding-tmrca-of-ethiopian-ydna.html
http://ethiohelix.blogspot.com/2012/11/extensive-doctoral-thesis-on-ethiopian.html
http://ethiohelix.blogspot.com/2013/01/tmrca-calculations-from-plaster-nry.html
http://ethiohelix.blogspot.com/2013/02/the-zhivotovsky-multiplier.html
http://ethiohelix.blogspot.com/2013/03/african-sahel-ydna.html

The code is written for Octave and is also Matlab compatible. There is also an instruction file that explains how to run the calculator in the folder that is linked above which can also be found below:
---------------------------------------------------------------------------------------------------------


To check if the TMRCA program is correctly working on your system, first run it with the dataset
provided here before trying different datasets, to do so:

(1) Make sure you have Octave loaded on your system (either Windows or Linux will work) and start octave in the command line.
(2) In the command line, change your working directory to the directory where you saved the unzipped  folder by using: cd ~PATH/TMRCA_ASD/
If you are unsure of your current working directory, type the command: pwd()
(3) Type: fcompositeTMRCA("Buckova_EM78","all")
(4) If this produces results, then the program and functions are correctly installed and you can proceed to reading and analysing different datasets.


Reading and analysing new Data

After correctly executing the above steps, read and analyse new data by using the following steps:
(1)open the example STR data file in the "TMRCA_ASD/Loaded_Data/" folder entitled "EM35_STR.xls"
(2)Any STR data file to be analysed should first be made in the same format as the "EM35_STR.xls" file , specifically:
(a) DYS names in the first row should have the exact same nomenclature (the orders can be different however).
(b) Each row (except the first) should represent one sample.
(c) Each coloumn (except the first) should represent repeats for one marker/DYS#.
(d) The first column should represent sample identifiers, ex. Kit#, sample ID,...
(e) The cell found in the first row and first column should have the Dataset's name, this will be the same   name used throughout the analysis.
(f) No cell shall contain null values and avoid having cells that contain characters which have spaces in between them.
(3) In Excel or openoffice, convert the "EM35_STR.xls" workbook to a ".csv" file by saving the file as "YSTR.csv" and placed into the
same "TMRCA_ASD/Loaded_Data/" folder. The program will only look for a file entitled "YSTR.csv", so make sure that the same name is used for your file.
(4) Start octave, in the command line, change the working directory to "~PATH/TMRCA_ASD/Loaded_Data/"
(5) Type on the octave prompt: readdata
(6) Octave will start reading the dataset and create the file "EM35-Balanced" in the folder "/TMRCA_ASD/Loaded_Data/" when it is finished.
(7) If you want to analyse a specific set of markers from your dataset go to setep 8, otherwise go to step 9
(8)Go to the file "/TMRCA_ASD/Markerlist/49markerlist.txt", and pick the markers you want to use for the analysis. Then save your chosen
markers into a new txt file in the same folder as "/TMRCA_ASD/Markerlist/". Take a look at the file "8_Chiaronimarkerlist.txt" for
an example of how the marker list should look.
(9) In octave, change your working directory back up one level by typing: cd ..
(10) If you are specifying a set of markers to use in the analysis, then run the program by typing: fcompositeTMRCA("EM35-Balanced","8_Chiaronimarkerlist.txt"), otherwise, just type: fcompositeTMRCA("EM35-Balanced","all").
----------------------------------------------------------------------------------------------------------
Update : Version2 -  *.CSV read, + Auto path detect. (fcompositeTMRCA.m, fmarkerextract.m, readdata.m)
Update(04/25/13) : Version3 - Add option for using all available markers, print used/unused markers. (fcompositeTMRCA.m, fmarkerextract.m, fAssignmutation.m)

Analyzing YDNA J lineages in Ethiopian linguistic groups

$
0
0
The extensive YDNA dataset found in the Plaster paper has a total of 691 YDNA lineages that belong to haplogroup J, although there is no more detailed SNP resolution reported for most of these lineages, it is safe to assume, from previous data on Ethiopia, that a vast majority of them would belong to J1-M267. There is a limited set of STR data that accompanies these lineages as well, namely only for the markers; 19, 388, 390, 391, 392 and 393.

According to the report, J lineages are proportionally found higher in Semitic speakers in Ethiopia, ~21% ,followed by Omotic speakers at ~ 12% and Cushitic speakers at ~  8%.  Out of the 691 YDNA J lineages reported, 259 were Semitic speakers, 266 spoke some type of Omotic language and most of the remainder spoke Cushitic languages.

Using the STR data provided, along with linguistic information, below I have estimated the respective TMRCAs using the previously outlined ASD method (and calculator) for the major linguistic groups, in addition to selected populations within those linguistic groups that were found with a high frequency of Haplogroup J.


  • Generally the Semitic speaking groups harbour the oldest J lineages, followed by Omotic and then Cushitic speaking groups
  • It is very rare to see similar and even less TMRCA estimates between the Zhiv. rates and the pedigree/familial rates as can be seen above (especially for Chandler), this could be due to the small numbers of markers used however
  • Within the specific groups tested, the Omotic speaking shekecho appear to have the oldest J lineages, followed by the Semitic speaking Gurage and the Cushitic speaking Kembata, while the Yem and Afar seem to harbour the youngest J lineages
  • Note that different samples of Agews are found in both the Semitic and Cushitic groups, that is because in those that are labeled under Agew_Cush, they are classified as Cushitic speakers but self identified as Agews, where as those labeled under Agew_Sem are those classified as Semitic speakers while also self identifying as Agews. 
  • Similarly, for those labeled under 'Amhara' in the Semitic group, are only who identified as Amhara, and not for all who spoke Amharic as a first language, since almost all the (239/259) samples that were classified as Semitic speakers, spoke Amharic as their first language, but identified differently from their first language, i.e. as Gurage, Tigray or Agew (and also other IDs traditionally held amongst non-semitic speakers)
  • Details of the analysis can be seen here

Analyzing YDNA A-M13 lineages in Ethiopian linguistic groups

$
0
0
Similar to the previous analysis of J lineages found in Ethiopia from the Plaster paper, the other prevalent lineage in Ethiopia, A-M13 (formerly known also as A3b2), is also analyzed below. A total of 616 A-M13 lineages were reported in the study, of which ~32% were classified as Semitic speakers, ~40% as Cushitic speakers, ~17% as Omotic speakers and the remainder within the Nilo-Saharan speaking macro-phylum.

The prevalence of Haplogroup A lineages in Ethiopia according to the paper ranges from ~20% in Nilo-Saharan speakers, to about 5% in Omotic speakers, with an intermediate prevalence in Semitic and Cushitic speakers of 16 and 12% respectively.


  • Either due to the limited set of markers or limited sample size, it is hard to say in which lingustic group A-M13 appears oldest in Ethiopia, if the Zhivotovsky rates are taken into account, it looks like the lineage is older in the samples that belong to the Cushitic speaking group, on the other hand, according to the pedigree/familial rates it would be older in the Nilo-Saharan speakers
  • On the basis of a crude average for the TMRCA's generated using both types of rates and for the specific groups listed above, the A-M13 lineage appears from oldest to youngest in this order; Anuak > Amhara > Gedeo > Nuer > Shekecho > Alaba > Agew_Sem > Kefa > Oromo > Agew_Cush > Tigray > Wolayta . 
  • More details of the analysis can be found here
Viewing all 74 articles
Browse latest View live