Thanks to a commenter going by the moniker 'Eze', who notified me the other day of a new program called Treemix, in which it infers “patterns of population splitting and mixing from genome-wide allele frequency data”, I had a chance to give it a try on the Intra-African Dataset that I have described previously.
After converting the input file into the desired format, I decided to play with several of its functionalities to become familiar with it,
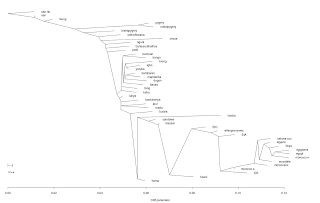
1) Default Maximum Likelihood (ML) Tree,

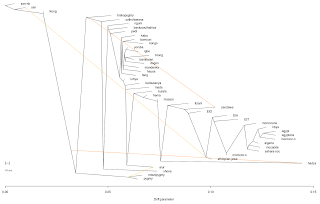
2) Default ML graph with 4 assumed migrations,

3) ML graph rooted with the San-nb,
4) ML graph with 4 migrations and rooted with the San-nb.
Other than that, the results are quite as expected, the North Africans are shown in both the default and rooted trees, but especially with the San-n rooted tree, as a branch of East Africans, and where East Africans in turn are seen as a branch of other Africans, consistent with evidence from uni-parental markers, as well as published papers, for an East African genesis of Eurasians, of which North-Africans can be used as a proxy for this particular Dataset.
The 4 inferred migrations in order of decreasing edges were;
-(Biaka Pygmy, Ancestral Sotho/tswana) → Sandawe, Migration edge:0.457032; likely an old hunter gatherers link. This was noted by Tishkoff (2009) : “These results suggest the possibility that the SAK, Hadza, Sandawe, and Pygmy populations are remnants of an historically more widespread proto-Khoesan- Pygmy population of hunter-gatherers.”
-(!kung,Ancestral to Biaka and Mbuti Pygmies) → Hadza, Migration edge:0.44087; potentially another early hunter gatherers link.
-Ethiopian Jews → San,Migration edge:0.188914; this could be a relic of early hunter-gatherer connections with Ethiopia (See: Ethiopians and Khoisan share the deepest clades of the human Y-chromosome phylogeny.) Another possible connection for this could be the migration of YDNA E1b1b1b2b (E-M293) carriers from Eastern Africa to Southern Africa within the past few millennia.
-Mbuti Pygmy → Alur, Migration edge:0.140627; this was also picked up by the ADMIXTURE analysis, where the Alur had significant amounts of Mbuti and Biaka pygmy components.
Further reading on the details behind the software featured in this post, TreeMix, can be found here: http://hdl.handle.net/10101/npre.2012.6956.1.
UPDATE: Run another one again rooted with the SAN from Namibia and 10 migrations assumed and got the following results, left column is Migration edge weight
0.586693 luhya →hema,hadza
0.508001 egyptans → EtA
0.504407 egyptans → EtT
0.442291 egyptans → Ethiopian-jews
0.432858 moroccans → fulani
0.27746 mbutipygmy,pygmy → sandawe
0.203223 mbutipygmy,pygmy → hadza
0.156929 egyptans → maasai
0.154406 moroccans → san
0.129901 pygmy → alur

Some of the results from the previous 4 assumed migrations run disappeared, it is not clear if migrations inferred from a lower m assumption are more statistically significant than those inferred from higher m assumptions. In general, this newer run resembles more of the K10 ADMIXTURE run, however there are some obscure differences, for instance, while it picked up a North to East African migration in the EtA, EtT and EtJ samples, it skipped the EtO samples and then picked up the same migration pattern in the maasai samples, whom had a lower 'North-African' component in the K10 ADMIXTURE run than the EtO samples. My take on this is that the program is not yet sophisticated enough to accommodate for bidirectional migrations that have happened for thousands of years, like the ones that have taken place between East and North Africa for instance. Indeed the authors of the software do list the following pertinent point as one of their assumptions:
"We also have modeled migration between populations as occurring at single, instantaneous time points."
and
"This model will work best when gene flow between populations is restricted to a relatively short time period. The relevance of this assumption will depend on the species and the populations considered."
UPDATE2: Residual plot for 10 migrations rooted with the San-nb.

